Energized Gas Pipeline
Erwin, Tennessee, USA
Date: March 16, 2007
Investigators: Doug Dorr, EPRI Brian Cramer, EPRI Chris Quillen, TVA Louie Shelton, Erwin Utilities
EquipmentUsed: Fluke 43 Power Analyzer Fluke 41B Power Analyzer AEMC Simple Logger® Stray Voltage Module L205
Background
TVA supported Erwin Utilities in the investigation of an abnormally high voltage along a 2.4-mile section of six-inch gas pipeline in Erwin, Tennessee. The reported problem was that the DC power source (a rectifier) for the pipeline corrosion-protection system was not operating properly, resulting in an elevated voltage on the pipeline to ground. Previous TVA measurements revealed up to 40 Vac on the pipeline, with a good correlation to the current levels recorded on a neutral conductor of a 12.47-kV multi-grounded wye distribution circuit.
Based on the prior measurements, the source appeared to be the distribution-system neutral (either conducted or coupled), and the receptor was the insulated segment of the gas pipeline. The primary objective of this investigation was to answer two questions: What was the actual path (conducted or induced) of the stray voltage and how could the problem be solved?
Summary Results
The measurements taken at the site showed a clear indication that the voltage was induced onto the pipeline. That is, the voltage on the pipeline was caused by the neutral current in the electrical distribution system. Investigators demonstrated this association by measuring the pipeline voltage to remote earth at four accessible points along the 2.4-mile insulated section: one at the supply end, one at 0.9 miles from the supply end, one at 1.5 miles from the supply end, and one at 2.4 miles from the supply end, as shown in Figure 1. The measurements were repeated with and without the supply end of the pipeline grounded to confirm the induction theory.
 |
| Figure 1: A Segment of Pipeline with Four Voltage-Access Points and the Parallel Locations of the Distribution Line |
Although the parallel sections of the distribution neutral and the pipeline were not continuous over the entire length of the pipe segment, the approximately one-mile length of parallel path did result in the following:
- With the supply end ungrounded: There was minimum voltage near the middle of the line and phase-shifted maximums near the ends (19 Vac at the regulator end and 28 Vac at the supply end).
- With the supply end grounded: There was minimum voltage at the grounded (supply) end (0.3 Vac) and approximately double the original voltage at the ungrounded (regulated) end (38 Vac instead of 19 Vac).
These results are exactly what would be expected for an induction situation, as shown in Figure 2. The dark blue line in the graph represents the voltage at the four access points when the regulator end of the insulated pipe segment was not grounded. The pink line represents the voltage when the regulator end of the insulated pipe segment was grounded. The negative voltages in the figure indicate that the voltage toward the supply end was out of phase with respect to the regulator end of the pipe segment. As shown in Figure 3, the pipeline voltage closely followed the variations in the current flowing in the neutral conductor of the parallel circuit.
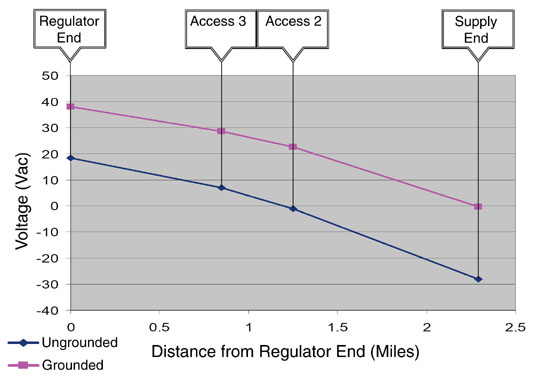 |
| Figure 2: Voltage at the Four Access Points with and without the Supply Grounded |
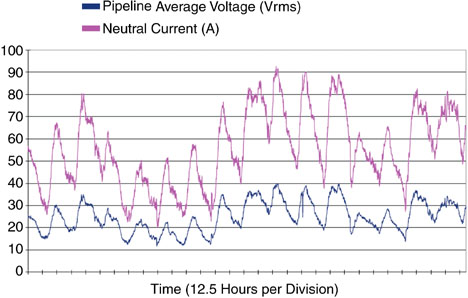 |
| Figure 3: Pipeline Voltage Correlated to the Current in the Parallel Neutral Conductor |
The remaining step in the investigation was to determine the best solution to the excessive pipe-to-ground voltages. There were several remediation options that the investigators could explore, once the parties involved agreed on an acceptable voltage level that would not interfere with the corrosion-protection system for the pipeline. The possible options included:
- Grounding the Pipeline: By grounding the pipeline at regular intervals (every 100 yards or so) with zinc ribbon cable, the voltage potentials between the grounded segments would create small circulation paths, reducing the voltages to much lower values. Grounding in the areas where the neutral was in parallel with the pipeline was the most desirable approach.
- Segmenting the Pipeline: Breaking the existing 2.4 miles of the insulated/isolated segment into at least four isolated segments would reduce the voltage to less than 15 Vac across each segment. For best results, two of these breaks would need to be in the middle of pipe lengths where the neutral conductor ran parallel.
- Reducing Current in the Source Neutral Conductor: Because the elevated voltage along the pipeline was directly proportional to the amount of current on the neutral circuit, back-feeding the circuit from the other end would perhaps reduce the neutral currents along the paralleled sections and acceptably reduce the voltage on the pipeline. Similarly, splitting the industrial park onto two feeds would accomplish the reduction objective. Other options could have been explored to decrease neutral current, such as increasing the voltage level of the distribution circuit.
The measurements and services provided by EPRI to date were covered by TVA’s participation in the research project Program 128.004, Elevated NEV and Urban Stray Voltage, in exchange for the right to share the generic information as one of the 2007 case-study deliverables for that project. We are confident in the described analysis of the measurements, however, If TVA is interested in pursuing more detailed assessment or modeling of the situation to more precisely define how each mitigation option would impact the pipeline voltage levels, EPRI would provide a quotation for those services based on a more detailed statement of work.
Detailed Measurement Data and Analysis
The following charts and graphs provide additional data from field measurements made during the investigation. Figure 4 shows the pipeline voltage near zero with source end of the pipe segment ungrounded, jumping to about 23 Vac with source end grounded.
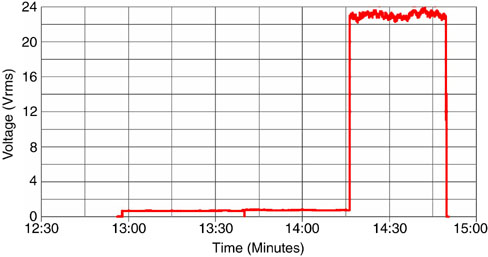 |
| Figure 4. AEMC Data Logger 2nd Right most data point in Figure 3 |
Figure 5 shows the voltage near 7 Vac with the source end of the pipe segment ungrounded, jumping to 28 Vac with source end grounded. Note that the maximum voltage limit of the data logger is 25 Vac, so the device was over its limit.
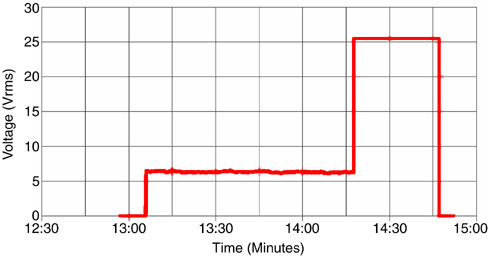 |
| Figure 5. AEMC Data Logger 2nd Left most data point in Figure 3 |
Figure 6 shows the 180-Hz pipeline voltage to earth measured at the regulator end of the pipe segment before the pipe was grounded at the supply end.
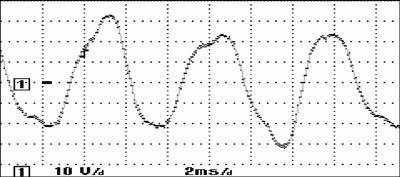 |
| Figure 6. 180-Hz Pipeline Voltage with the Supply End Ungrounded |
Figure 7 shows the harmonic spectrum for the voltage shown in Figure 6. Note that the fundamental is shown as 180 Hz instead of 60 Hz, which is due to the induction from the neutral (not the phases).
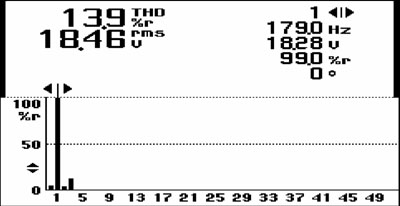 |
| Figure 7. Harmonic Spectrum for Voltage Shown in Figure 6 |
Figure 8 shows the voltage (38 Vrms) at the regulator end of the pipe segment when the supply end was grounded. Compared to Figure 6, the voltage increased from 18.5 Vrms to 38 Vrms. These points can both be seen on the left most data points in Figure 3.
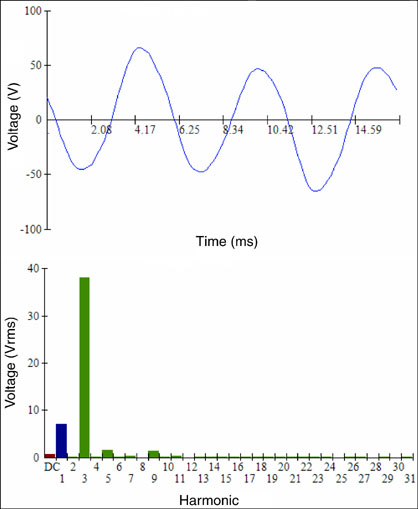 |
| Figure 8. Voltage at the Regulator End with the Supply End Grounded |
Figure 9 shows the 180-Hz pipeline voltage to earth and current measured at the supply end of pipe segment before the pipe was grounded at the supply end.
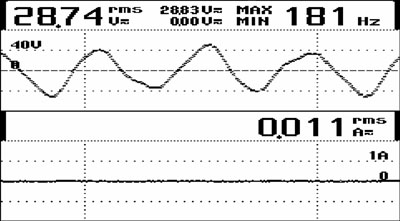 |
| Figure 9. 180-Hz Pipeline Voltage and Current with the Supply End Ungrounded |
Figure 10 shows the harmonic spectrum for voltage shown in Figure 9. Note that the fundamental is shown as 180 Hz.
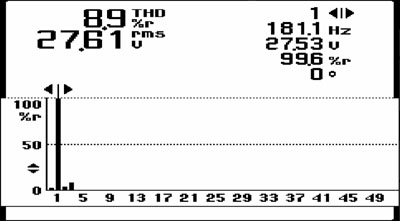 |
| Figure 10. Harmonic Spectrum for Voltage Shown in Figure 9 |
Figure 11 shows the voltage from the pipeline to earth and current at the supply end of the pipe segment after the pipe was grounded.
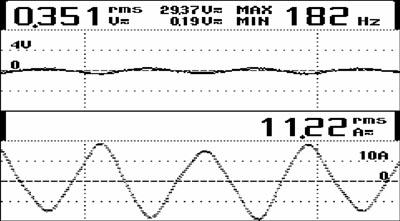 |
| Figure 11. Pipeline Voltage and Current at the Supply End with the Supply End Grounded |
Figure 12 shows the voltage from the pipeline to earth and current at the mid section of pipeline prior to grounding of the pipe.
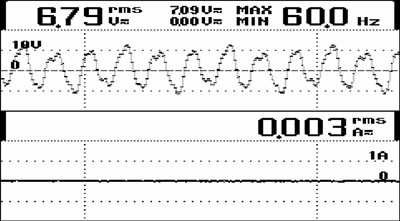 |
| Figure 12. Pipeline Voltage and Current at Mid Section of Pipeline with the Supply End Ungrounded |
Figure 13 shows the harmonic spectrum for voltage shown in Figure 12. Note that there was a small 60-Hz component at this point on the pipe segment.
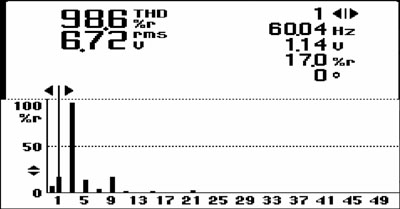 |
| Figure 13. Harmonic Spectrum for Voltage Shown in Figure 12 |
Figure 14 shows the harmonic content of an example elevated neutral voltage at a distribution pole near a parallel section of the pipeline and power line. Note the small DC component, some 60-Hz, and odd triplen harmonics.
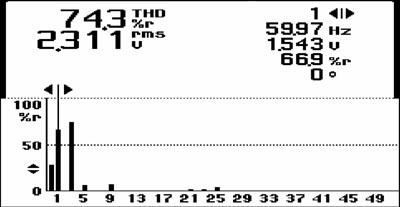 |
| Figure 14. Harmonic Content of an Example Elevated Neutral Voltage |
Figure 15 shows the elevated neutral voltage at a point close to the maximum circuit loading.
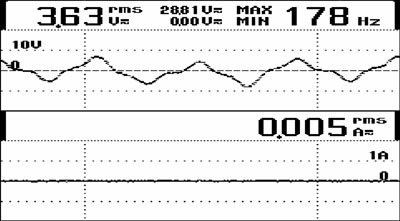 |
| Figure 15. Elevated Neutral Voltage Approaching the Maximum Circuit Loading |
